| PREVIOUS PRESENTATION | BACK TO PROGRAM OVERVIEW | NEXT PRESENTATION |
Methods for fast and accurate material properties estimate with terahertz time-domain spectroscopy in transmission and reflection with optically thick materials
Vincent Goumarre1,†, Yasith Amarasinghe1,†, Martin Lahn Henriksen2, Mogens Hinge2, and Pernille Klarskov1
1Terahertz Photonics, Department of Electrical and Computer Engineering, Aarhus University, Finlandsgade 22, DK-8200, Aarhus N, Denmark
2Plastic and Polymer Engineering, Department of Biological and Chemical Engineering, Aarhus University, Aabogade 40, DK-8200 Aarhus N., Denmark
†These authors contributed equally to this work
Terahertz time-domain spectroscopy is commonly used for extraction of material parameters [1]. Precise estimates of the dielectric properties of the material can be done by using the Fabry-Perot effect and iterative methods [2]. In this study, we developed transmission and reflection spectroscopy methods to compute the refractive index, absorption coefficient and thickness of a sample precisely without proceeding to an iterative correction of the dielectric properties.
Transmission
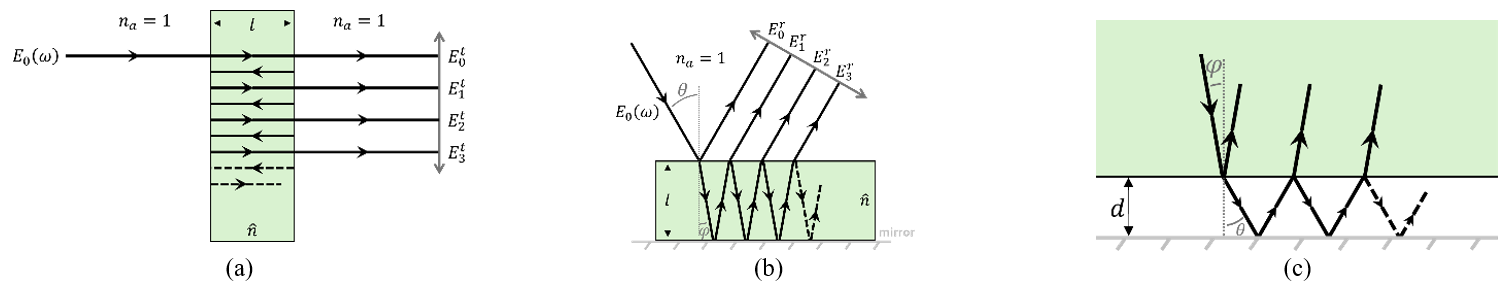
Figure 1: Propagation of the terahertz waves in the sample for (a) the transmission geometry, (b) the reflection geometry, and (c) in the layer of air between the sample and the mirror. The terms \(E_N^{t,r}\) are the amplitudes of the measured electric fields.
The propagation of the terahertz waves in the transmission geometry is schematized in Figure 1(a). The model for the transfer function, including the Fabry-Perot effect, is given by [3]:
$$H^t(\omega)=\frac{T_{as}^tT_{sa}^te^{-\kappa\omega l/c}e^{-j(n-1)\omega l/c}}{1-(R_{sa}^t)^2e^{-2\kappa\omega l/c}e^{-2jn\omega l/c}} ,$$
where \(T_{as}^t, T_{sa}^t\) and \(R_{sa}^t} are the Fresnel coefficients at normal incidence for the interface between the sample (s) and the air (a), ω is the angular frequency, and l is the sample thickness. When the phase of the transfer function is unwrapped, the following relation can be found:
$$\angle H^t(\omega)=(n-1)\frac{\omega l}{c}+\mathrm{atan2}\left[(R_{sa}^t)^2e^{-2\kappa\omega l/c}\sin\left(\frac{2n\omega l}{c}\right),1-(R_{sa}^t)^2e^{-2\kappa\omega l/c}\cos\left(\frac{2n\omega l}{c}\right)\right] .$$
This equation is very similar to the case where only \(E_0^t\) is considered [3], with an additional term atan2 corresponding to the Fabry-Perot effect. The phase depends both on the refractive index \(n\) and the extinction coefficient \(\kappa\). However, from the modulus of the transfer function, the extinction coefficient can be expressed as a function of the refractive index:
$$\left(e^{-2\kappa\omega l/c}\right)_n^- = \left\{
\begin{matrix} \frac{\frac{(T_{as}^tT_{sa}^t)^2}{|H^t|^2} + 2(R_{sa}^t)^2\cos(2n\omega l/c) -\sqrt{\left[\frac{(T_{as}^tT_{sa}^t)^2}{|H|^2}+2(R_{sa}^t)^2\cos(2n\omega l/c)\right]^2-4(R_{sa}^t)^4} }{2(R_{sa}^t)^4}
& \mathrm{if} \left[\frac{(T_{as}^tT_{sa}^t)^2}{|H|^2}+2(R_{sa}^t)^2\cos(2n\omega l/c)\right]\ge 4(R_{sa}^t)^4, \\
\frac{1}{(R_{sa}^t)^2} &\mathrm{if} \left[\frac{(T_{as}^tT_{sa}^t)^2}{|H|^2}+2(R_{sa}^t)^2\cos(2n\omega l/c)\right] \lt 4(R_{sa}^t)^4. \end{matrix} \right.$$
Inserting this expression in the phase equation, the refractive index can be deduced by using Dekker’s method [4]. The thickness of the sample is estimated by minimizing the total variation as done in Ref. [2].
Reflection
The reflection experiment used in this study is a sample lying on a mirror, as depicted in Figure 1(b). This experimental setup induces a thin layer of air d between the sample and the mirror (see Figure 1(c)).
The reflection transfer function is defined as the spectrum with the sample divided by the spectrum without the sample:
$$ H_{echo}^r(\omega)=\frac{T_{as}^rT_{sa}^rH_{sm}e^{-2\frac{\kappa}{\cos\phi}\frac{\omega l}{c}} e^{-2j(\sqrt{n^2-\sin^2\theta}-\cos\theta)\frac{\omega l}{c}} }
{1-H_{sm}R_{am}R_{sa}^re^{-2j(\sqrt{n^2-\sin^2\theta}\frac{\omega l}{c}+\cos\theta\frac{\omega d}{c})} } .$$
The angles \(\theta\) and \(\phi\) are the incident and transmitted angle while \(T_{as}^r, T_{sa}^r\) and \(R_{sa}^r\) are the Fresnel coefficients for the air/sample interface, \(R_{am}=-1\) is the air/mirror reflection and \(H_{sm}\) is a correction coefficient taking into account the multiple reflections at the sample/mirror interface with a thickness \(d\). To extract the transfer function, the signal \(E_0^r\) has been removed. Similarly to the case of the transmission geometry, the extinction coefficient can be expressed as a function of the refractive index by using the modulus of the transfer function:
$$\left(e^{-2\frac{\kappa}{\cos\phi}\frac{\omega l}{c}}\right)_n = \frac{1}{|H_{sm}|}\left[\frac{(T_{as}^rT_{sa}^r)^2}{|H_{echo}^r|^2}+(R_{sa}^rR_{am}^r)^2 +2\frac{T_{as}^rT_{sa}^r}{|H_{echo}^r|}R_{sa}^rR_{am}^r\cos\left(2\cos\theta\frac{\omega(l+d)}{c}+\Theta_{H_{echo}^r} \right) \right]^{-1/2}$$
Using the unwrapped phase of the transfer function, the following function can be defined:
$$\begin{align}
\angle H_{echo}^r(\omega) & = 2\left(\sqrt{n^2-\sin^2\theta}-\cos\theta\right)\frac{\omega l}{c}-\Theta_{sm} \\
& -\mathrm{atan2}\left[R_{sa}^rR_{am}|H_{sm}|\left(e^{-2\frac{\kappa}{\cos\phi}\frac{\omega l}{c}}\right)_n\sin\left(2\sqrt{n^2-\sin^2\theta}\frac{\omega l}{c}+2\cos\theta\frac{\omega d}{c}-\Theta_{sm}\right),\right. \\
&\left.1-R_{sa}^rR_{am}|H_{sm}|\left(e^{-2\frac{\kappa}{\cos\phi}\frac{\omega l}{c}}\right)_n\sin\left(2\sqrt{n^2-\sin^2\theta}\frac{\omega l}{c}+2\cos\theta\frac{\omega d}{c}-\Theta_{sm}\right)\right] .\end{align}$$
This can once again be done by Dekker’s method, since this is only a function of the refractive index. One of the challenges in the reflection geometry is that there are now two thicknesses to estimate: \(l\) and \(d\). The amount \(l+d\) can easily be deduced by the total variation technique while \(d\) is deduced by fitting a function without inflection.
Results
The method presented is applied to the same silicon wafer in transmission and in reflection. The results are presented below.
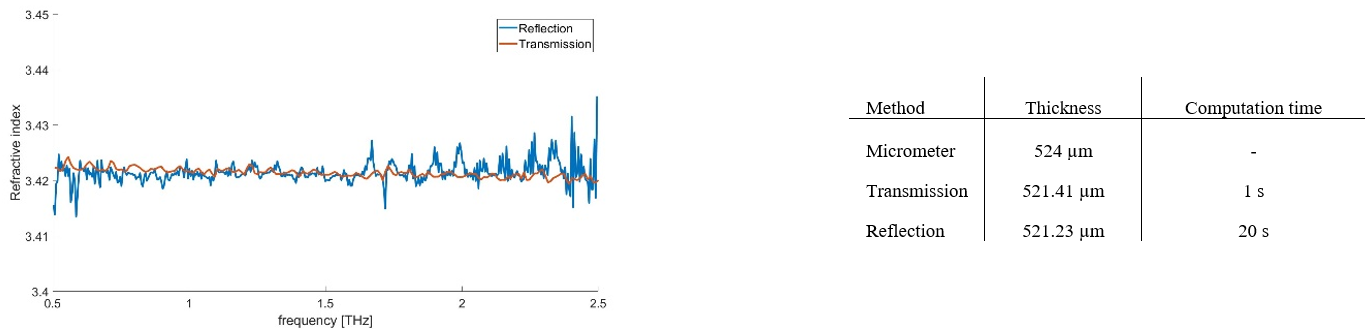
Figure 2: Refractive index (left) and thickness (right) of the silicon wafer as measured by the transmission and reflection THz spectroscopy.
The results obtained for the transmission and reflection geometry are consistent and match with other methods [2]. A strength of this result is to improve the computation time compared to Dorney et al.’s method (around 3 minutes for transmission). In the reflection geometry, the layer of air under the sample is essential to have a good estimate of the refractive index.
References
[1] P. U. Jepsen, D. G. Cooke, and M. Koch, “Terahertz spectroscopy and imaging – Modern techniques and applications,” Laser Photon. Rev. 5, 124-166 (2011)
[2] T. D. Dorney, R. G. Baraniuk, and D. M. Mittleman, “Material parameter estimation with terahertz time-domain spectroscopy,” J. Opt. Soc. Am. A-Opt. Image Sci. Vis. 18, 1562-1571 (2001)
[3] W. Withayachumnankul, and M. Naftaly, “Fundamentals of Measurement in Terahertz Time-Domain Spectroscopy,” J. Infrared Millim. Terahertz Waves 35, 610-637 (2014)
[4] T. J. Dekker, “Finding a zero by means of successive linear interpolation,” in Constructive aspects of the fundamental theorem of algebra, B. Dejon, and P. Henrici, eds. (Wiley-Interscience, 1969)